In my last blog post I talked about the strategic and competitive advantages that can be delivered by Business Analytics but that a lot of companies are still struggling to apply Analytics and actually gain these advantages. This post is the first in a series of three where the added value of Analytics in Marketing will be discussed.
I'll give an overview of Analytics techniques tailored to a better understanding of your customers and their specific needs. In the following blog posts my colleagues will discuss two concrete cases: one on Customer Segmentation & Profiling for a training provider and one on Churn Prediction for a bank. If you really want to have a deep dive into some of the techniques we'll discuss in this series then subscribe to the training Data Analytics for Marketeers (in Dutch) organised by Wolters Kluwer and given by my colleagues Jessica and Davy.
Some of the tips I gave in my previous blog post will become readily clear from the discussions:
- multidisciplinarity is key to success
- involve the business
- show the added value of the developed Analytics models
- look into open source alternatives and start experimenting
For all techniques in this post there are some really good open source algorithms available in R (The R Project for Statistical Computing). The cases that we'll discuss in the following two posts of this series have both been realised with such algorithms.
Marketing in the Digital Age
Marketing is communicating the value of a product, service or brand to customers, for the purpose of promoting or selling that product, service, or brand.
One Way Mass Communication
For a long time marketing has been mainly a one way (one to many) communication. Magazines, posters, billboards, radio and television were the preferred channels for a company to communicate the value of their products to a broad audience. In the 1970s a new trend arose: telemarketing. Although it shifted communication from one to many into a more "personal" one to one mode, telemarketing is also one way communication.
With the advent of the PC and the growing penetration of internet in households world-wide, new opportunities opened up for marketeers. However in the beginning it was still all about one way mass communication.
In April 1994, Phoenix Law Firm Canter & Seigel advertised their services by posting a message on several thousand newsgroups. This is likely the first automated, large-scale example of spam. It is also the incident that made the term popular.
The Age of Inbound Marketing
After the dot-com bubble burst, the internet now begins to enter a new age, characterised by a greater emphasis on information sharing, user-centric design and collaboration. This new trend -driven by technological advancements like Social Media, Analytics and Mobile- leads to customers engaging with brands in new ways.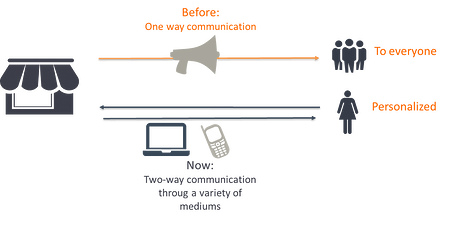
Instead of simply pushing advertising to customers online, the benefits of creating value for customers and earning their business begins to take hold. Studies have shown that a personalised (email) advertising message to a limited number of recipients is much more effective than an impersonal mass mailing to thousands of email accounts.
Companies that can provide value and engage with customers in meaningful and exciting ways stand to reap benefits in the coming years.
But how can we do this? How can we get to know our customers in such a way that we can send them personalised messages, create value and engage with them in meaningful and exciting ways?
Customer Intelligence
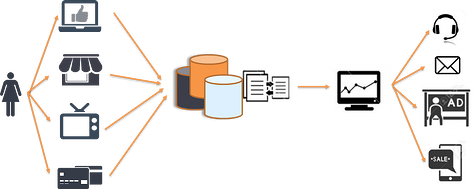
Customers leave a digital footprint behind every time they purchase a product, make use of a service, surf the web, engage in Social Media, when they watch television and so on. This means we have a lot of data about our customers: where they live, how old they are, how many times they contacted the helpdesk, what products they purchased in the past or the evolution of their monthly invoices,…
With Analytics we can analyse all this data with smart algorithms enabling us to build models that describe the hidden complex patterns and relationships underlying the data, which leads us to gain new insights about our customers.
The Customer Analytics Record
We start by constructing a Customer Analytics Record (CAR) to describe the customer and use this as input to build Analytics models. Such a record consists of a number of variables representing characteristics of a particular customer. We make a distinction between different types of variables as can be seen in the figure below. 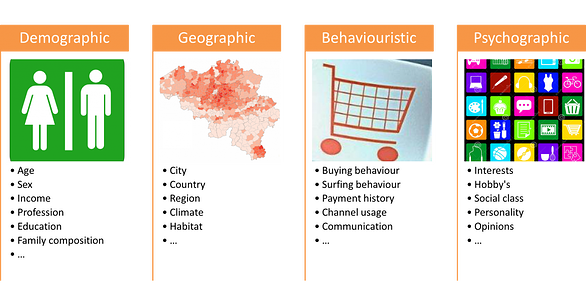
In general, demographic and geographic variables are the easiest to obtain as most companies have them available in their CRM database and/or in a Data Warehouse. Behaviouristic variables often have to be collected from different sources like purchase and accountancy systems, weblogs, callcenter applications, etc. Psychographic variables are the hardest to obtain as they describe customer characteristics that reflect things like opinions and ideas which are in general not readily available in applications and databases. Typically such variables can be extracted from Social Media (e.g. Facebook and Twitter).
We don't need all types of variables to gain relevant insights about our customers. However, the variables should be sufficiently discriminating in describing the differences between the customers in our customer base. From the example below it becomes clear that, although Prince Charles and Ozzy Osbourne share the same demographic variables, they actually exhibit quite different behaviour. On the other hand, just taking as much variables as possible is not a good strategy either, especially when the different variables are strongly correlated or have little discriminating power.
So building a CAR is a process that requires business involvement as knowledge about the specific business context (e.g. sector) plays an important role in choosing the right variables. Particularly the behaviouristic variables will have a strong dependence on the specific business context, e.g. in a banking context a behaviouristic variable might be the amount of money transferred each month, or the number of transactions done by mobile banking versus the number of transactions done in a physical bank office. In the case of a telecom operator on the other hand, typical behaviouristic variables could include the monthly data volume of mobile internet, the number of text messages sent or the evolution of the amount of the monthly invoices.
Constructing a CAR typically consists of a number of steps that require different skills and competences:
- Identify the available data sources and actual extraction of the data.
- Get to know the data by performing basic statistical analysis of the data like distributions, histograms, pie charts, outlier detection etc.
- Select the relevant variables that describe the characteristics of the customer not only related to the specific business context but also in function of the Analytics technique that will be applied.
- Clean and transform the data, e.g. remove outliers, rescaling, discretization, etc.
Building Predictive and Descriptive Models
Once we have created our CAR, we can start building Analytics models. We can make a distinction between different types of models:
- Descriptive Models describe underlying patterns and relations in the the data.
- Predictive Models predict future behaviour based on historical data and past experiences.
- Prescriptive Models go beyond predicting future outcomes by also suggesting actions to benefit from the predictions and showing the implications of each decision option.
Building Analytics models is an iterative and incremental process. Start from a simple base (e.g. one data source, one technique), evaluate the model quality and interpret the results (together with Business/Domain Experts). Then you can add complexity (e.g. more data sources, a combination of different techniques) while iterating and building upon previous results.
Customer Segmentation & Profiling
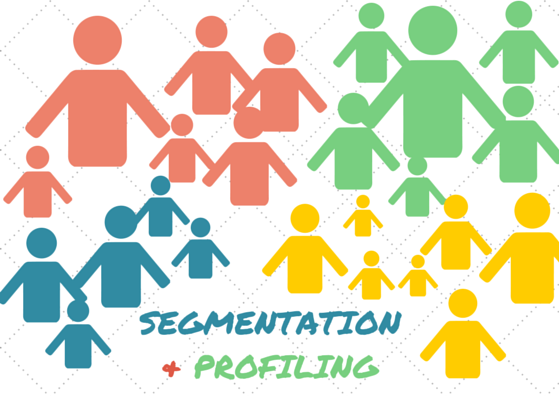
Customer segmentation and profiling is a descriptive modelling technique that allows us to use customers’ behaviour together with other characteristics such as demographics (i.e. the CAR), as a means to categorise them into similar groups or segments of customers that exhibit similar behaviour.
Often, classical segmentation methods stop here. But we can do more. The customers in one segment will not be identical, they will share a number of characteristics but over the total population of a segment there will also be quite some characteristics that differ. So just categorising customers into segments doesn't tell us much about a typical customer in a segment. Therefore we add an additional profiling step. We make up profiles describing a typical customer in a segment in terms of clear and relevant business terminology like the characteristics of the Customer Analytics Record.
For this purpose we choose a target, i.e. what type of customer are we looking for exactly? We call this targeted profiling. The advantage of targeted profiling is focus. We focus on a specific type of customer we are interested in. Examples of targets include: customers that are interested in a specific (group of) product(s), good customers or customers that make use of our mobile app.
The resulting profiles can be used in many different ways. One way is to look for customers in our customer base that have a great resemblance to the targeted profile but do not belong to the target group yet (e.g. the customers that have similar/the same profiles as the ones who bought a specific product but didn't buy it yet). This group of customers is an interesting group to target with specific and personalised advertising campaigns for that particular product. Another way to use the profiles is to make up personas that can form the basis for a customer journey mapping exercise.
Churn Prediction
One predictive modelling technique that is particularly interesting in a Marketing context is Churn Prediction. Churn Prediction has the objective to predict the probability that a customer will leave and go to the competition.
Typically this is done based on the behaviour the customer exhibited over a given period in the past, e.g. how many times did she/he call the help desk, what is the evolution of the monthly invoices, did the customer cancel any orders or services, how many times did she/he login to her/his personal profile on the website, etc. So, behaviouristic variables clearly play an important role in Churn Prediction.
By calculating churn scores (probabilities) for all their customers on a regular basis, organisations can pro-actively manage the risks of individual customers leaving for the competition or even detect and act upon global trends of larger groups of customers that are likely to churn. Often this is done by specifically targeting those customers who are likely to churn with specific marketing campaigns and promotions.
Market Basket Analysis
Market Basket Analysis is a descriptive analytics technique that is particularly useful in a (r)etail context. The term refers to the actual basket that customers use to put in their purchases in a physical store or the virtual basket on a web shop. By analysing which products are often bought together we can send tailored offers to our customers based on their buying history. On a webshop we can propose products the customer likely is interested in, based on the current contents of her or his basket.
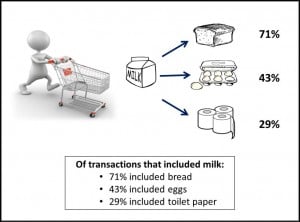
But we can do a lot more than that. We can gain advanced insights in our products and how they relate to each other in different contexts. We call this product intelligence. Examples of such questions that could be answered with a Market Basket Analysis are given in the figure below.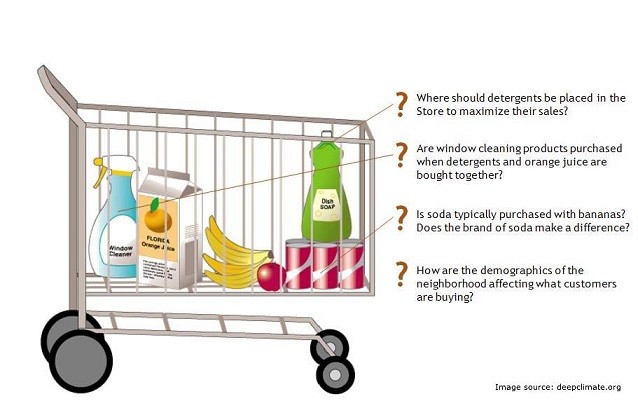
Note that in this case the CAR takes on a different form than in the previous examples. First of all, to calculate the relative probabilities of products being bought together, we only consider behaviouristic variables about the buying behaviour of the customers. And secondly we look at transactions of customers rather than the customers themselves. Typically this information is obtained through the customer loyalty cards that retailers offer to their customers. It is a win-win situation: the customer can get additional discounts and the company collects valuable information about the buying behaviour of the customer. Of course, on a web shop the information is readily available through the history of purchases recorded by the system.
But we can do more. The transactions can be enriched with information about the store (e.g. neighbourhood demographics) and with information about the customer (e.g. demographic variables from the CAR) so we can relate the gained insights to similar stores and/or customers. Consider the following example:
In this example there are 5 transactions of two customers in four different "types" of stores, i.e. a small store in the city, a large one in the countryside and the other way around a small store in the countryside and a large one in the city. To calculate the relative probabilities of products being bought together we only need the transactions but if we also want to relate buying behaviour to the store and/or customers we would also include the store information and/or CAR.
Another way to use the CAR is in combination with the Segmentation & Profiling approach discussed above. We can relate buying behaviour to specific segments and profiles which would allow us to target these profiles with specific offers for products they are likely interested in.
Combining different modelling techniques and data sources is often very powerful and can gives us even better insights in our customers and their behaviour.
Social Media Analytics
Until now we only considered the analysis of internal data that is already present within the databases and applications of the company. Social Media Analytics is a whole different ball game as it requires the extraction of data from social media platforms like Twitter, LinkedIn, Facebook etc. Without going into details I will briefly discuss here a number of possible applications of Social Media Analytics together with the main implications of collecting, storing and analysing the data.
Applications of Social Media Analytics
We have seen that the Age of Inbound Marketing is characterised by a greater emphasis on information sharing, user-centric design and collaboration; leading to customers engaging with brands in new ways, mainly through Social Media. Therefore it is not surprising that these Social Media potentially contain a lot of valuable information about our customers, company and products or services. Consider the following applications.
- Extraction of Profile Information: We can extract information about the profiles of our customers on the Social Media. It is particularly interesting to collect psychographic variables that can be used to enrich the Customer Analytics Record as discussed above.
- Impact Analysis of the use of Social Media: If you are a company that makes extensive use of Social Media you might want to analyse the impact of your communication efforts through Social Media. There are a lot of products on the market that offer great functionality to do so, the best known probably being Google Analytics.
- Trend Analysis: What are people talking about on Social Media? How many times was your company mentioned? How many times was a particular product mentioned? Are people talking about that television commercial you just launched?
- Sentiment Analysis: This is a specific form of Trend Analysis in which the purpose is to get an idea about the sentiment or emotions people show when they are talking about your company and its products. Are they talking in a positive way or in a negative way about your company or maybe in a rather neutral way?
Implications of Social Media Analytics
Social Media Analytics requires a number of specific techniques and considerations one has to take into account. Have a look at the following overview:
- Connect to the Social Media: You need to actually connect to the Social Media you want to analyse. The different Social Media platforms have API's and specific procedures to do so.
- Collect and Store the Data: Data you extract from Social Media is unstructured and comes in a specific format like the JSON format. Collecting, storing and analysing such data requires specific techniques and technology. Particularly when you want to analyse large amounts of Social Media interactions you will need Big Data technology like NoSQL data stores.
- Identification of your Customers: If you want to analyse the behaviour of specific customers on Social Media or if you want to extract profile information to enrich the CAR, you will need ways to identify your customers on the Social Media. Often this is done by just asking your customers to share this information with you, e.g. by offering them a special promotion if they do so or by providing a Facebook logon on your website.
- Privacy Concerns: You have to take great care of the privacy of your customers (and others) on Social Media. Proceed with caution and only use data that is publicly available or data for which you have explicit permission of your customers to use it for analysis.
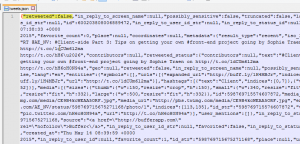
The figure below gives an example of a snippet of JSON representing a Tweet (you can click on the image to get a full size detailed view). It has been taken from the following blog post Using Talend and MongoDB to Process and Store Tweets in a Lossless Form written by my colleague Carlo Wouters.
The blog post explains in a very concise and clear way how to connect to Twitter, collect Tweets and store them in a NoSQL database. Another way to get you started quickly is by using the twitteR and tm (Text Mining) packages from R (The R Project for Statistical Computing) which can be freely downloaded from the Comprehensive R Archive Network (CRAN). A nice example of these packages in action can be found in the following blog post on RDataMining.com.
Conclusions and Takeaways
Using Analytics for marketing is a powerful way to gain advanced insights in your customers, far beyond the classical business intelligence and data warehouse reporting. It gives marketeers the possibility to engage with customers, shifting from one way mass communication to a more personalised two way communication. This makes it possible to maximize opportunities for cross and up selling and the delivery of products, services and promotions tailored to the needs of our customers.
Instead of simply pushing advertising at customers online, we can benefit from the advantages of creating value for customers and earning their business.
Companies that can provide value and engage with customers in meaningful and exciting ways stand to reap benefits in the coming years.
Some important points to remind:
- There are a number of basic techniques that can be used in different business contexts. Different techniques answer different questions.
- Good data is key to success. Build your Customer Analytics Record with care. Analyse, clean and transform the data. Do it together with the business because the variables you use greatly depend on the specific business context.
- Start from a simple basis, iterate and add complexity by incrementally building upon earlier results, involve the business throughout the entire process.
- Combining different techniques and data sources can give you even greater insights and is a very powerful way to get to know your customers even better.
Ready up!
If you are interested to know more, you should certainly check out the upcoming posts on Customer Segmentation & Profiling and Churn Prediction.
You want to have a deep dive into some of the techniques that have been discussed in this blog post or you want to get hands-on experience? We regularly provide training sessions, in-company coaching and a lot more.
In the meantime I am looking forward to any thoughts or ideas you may have!


